In the complex world of vessel operations, achieving peak performance requires harmony between technical management and commercial priorities. Technical teams strive for optimal machinery function and longevity, while commercial teams focus on fulfilling Charter Party (CP) agreements and maximising voyage profitability. Often, these objectives can seem distinct, potentially leading to misaligned operational strategies if teams lack a common, transparent view of performance data against critical limits.
Modern performance platforms offer a solution by providing an integrated, visual representation of key operational data. Displaying parameters like speed and consumption alongside crucial boundaries – including CP limits, engine manufacturer limits like Normal Continuous Rating (NCR), and efficiency thresholds like blower cut-in points – creates a holistic operational picture. This shared view empowers both technical and commercial teams with the insights needed for aligned, data-driven decision-making, applicable across the fleet, whether using high-frequency sensor data or enriched noon report analysis available through solutions like ZeroNorth's SMARTShip Prime.
Understanding and monitoring Charter Party (CP) limits
Charter Party agreements form the commercial backbone of many voyages, defining the operational boundaries agreed upon between owner and charterer. These typically specify warranted speeds and corresponding maximum fuel consumption rates under defined 'good weather' conditions. Adhering strictly to these CP limits is paramount for avoiding potentially costly underperformance claims or disputes over excess fuel usage. Failing to meet speed warranties can result in financial penalties for time lost, while exceeding consumption limits might lead to claims from the charterer for the extra fuel burned.
Advanced performance platforms transform CP compliance monitoring from a retrospective analysis into a proactive, voyage-centric activity. Key capabilities include:
Clear visualisation: Instead of manual checks against contract clauses, these systems plot CP speed and consumption warranties directly onto performance dashboards. Defined allowances (e.g., +/- half a knot speed, +5% consumption) can be shown as tolerance bands, providing an immediate visual reference of actual performance against the contractual requirements.
Contextual performance data: Vessel speed and consumption data, whether from sensors or validated noon reports combined with AIS and weather data, are plotted onto these charts. Colour-coding or other visual cues instantly highlight data points falling outside acceptable CP ranges during good weather periods.
Quantified impact: Digital platforms can automatically calculate the commercial impact of deviations. Consistent operation below warranted speed translates into calculated time lost, while exceeding consumption limits results in quantified excess fuel burn, providing clear metrics for performance discussions.
Automated reporting: Detailed end-of-voyage reports can be generated automatically, comparing performance against CP terms during both good weather and all weather periods, incorporating verified third-party weather data. This robust documentation supports efficient post-voyage analysis and dispute resolution.
Customisable settings: Flexibility allows users to define CP terms, good weather criteria (wind, wave, current parameters), specific allowances, and preferred data sources within the system, ensuring the monitoring precisely matches the relevant charter agreement.
Operating within Normal Continuous Rating (NCR) boundaries
From a technical perspective, respecting the engine's design limits is fundamental. The Normal Continuous Rating (NCR) represents the maximum power output an engine is designed to sustain continuously under normal conditions without risking damage or accelerated wear. Operating consistently above the NCR can lead to increased thermal and mechanical stresses, elevated exhaust temperatures, higher fuel consumption, and potentially shorten the engine's lifespan, increasing maintenance needs.
Data analytics tools play a key role in helping operators maintain operations within safe limits:
Visualising the envelope: NCR boundaries are typically displayed on performance charts (often speed-consumption or load-based) as clear lines or shaded areas, defining the upper limit of the recommended continuous operational envelope.
Real-time context: Plotting the vessel's current or recent operating point (speed/consumption or engine load) directly against these NCR boundaries provides immediate awareness. Operators and shore teams can instantly see how close they are operating to the engine's maximum continuous rating.
Informed Speed/Load decisions: This visual feedback empowers informed decisions. If operations trend too close to or exceed the NCR boundary, adjustments to speed or engine load can be made proactively to bring the operating point back within the optimal range, ensuring efficiency without compromising engine health.
Shared understanding: A common visual representation facilitates clear communication between onboard crew, technical superintendents, and performance teams ashore regarding engine operating practices, ensuring everyone understands the importance of respecting NCR limits.
Optimising around blower cut-in points
Engine fuel efficiency is significantly influenced by the operation of the turbocharger system, particularly the auxiliary blower cut-in point. This point marks the engine load threshold where the auxiliary blower engages to supply additional air needed for efficient combustion at higher loads. Operating inefficiently around this point can impact Specific Fuel Oil Consumption (SFOC). Below the cut-in point, the engine may have excess air, potentially leading to slightly higher SFOC. Above it, the blower ensures sufficient air, improving combustion efficiency. Frequent operation very close to the cut-in point, causing the blower to cycle on and off, can also be inefficient.
Performance monitoring systems like SMARTShip help optimise operations relative to this threshold:
Displaying the threshold: The blower cut-in point (or range) can be clearly marked on relevant performance dashboards, typically those showing engine load or speed/consumption relationships.
Identifying operating patterns: By monitoring the vessel's operating data points relative to the blower cut-in threshold over time, patterns become visible. Is the vessel frequently operating just below, just above, or constantly crossing this point?
Efficiency adjustments: Understanding these patterns allows for informed adjustments. Small changes in vessel speed or engine load might shift the operating point firmly into a more consistently efficient regime – either sufficiently below or sufficiently above the cut-in threshold, potentially leading to noticeable fuel savings over a voyage. Analytics tools like SMARTAnalytics available in SMARTShip Prime can further help analyse SFOC trends in relation to engine load based on reported data.
The essential role of data normalisation
Meaningful analysis of vessel performance against any limit – CP, NCR, or efficiency points – requires accounting for external variables. Raw operational data, particularly from daily noon reports, is heavily influenced by the conditions encountered. Comparing performance across different days or voyages is unreliable without first normalising the data.
Advanced performance platforms address this through sophisticated algorithms:
Weather normalisation: Algorithms correct speed and consumption data for the impact of wind, waves, and currents, using reliable input from integrated third-party weather providers combined with vessel reports or AIS data. This ensures comparisons reflect the vessel's performance as if under standardised weather conditions (e.g., Beaufort 3 ).
Draft normalisation: Changes in vessel draft significantly alter hydrodynamic resistance. Normalisation adjusts performance data to a common draft condition (e.g., design, ballast, or scantling draft ), allowing accurate assessments across different loading states.
Fuel type normalisation: Different fuel batches can have varying energy content (LCV) or density. Normalisation accounts for these variations, ensuring observed performance changes are attributable to the vessel or operations, not the fuel itself.
Achieving clarity: The result of robust normalisation is clarity. Scattered raw data points transform into coherent trends, revealing the vessel's true performance trajectory, accurately reflecting hull condition changes, or isolating the impact of operational adjustments. This validated, normalised data forms the reliable foundation for monitoring against all critical limits.
Fostering collaboration through a unified view
Ultimately, optimising vessel operations requires effective communication and collaboration between technical and commercial teams. Integrated performance visualisation platforms serve as powerful tools to achieve this alignment.
By presenting critical information – CP limits, engine boundaries, normalised performance data, hull condition metrics, emissions data – within a shared, easily understandable visual interface, these systems break down traditional information silos. Technical managers can clearly illustrate machinery constraints or efficiency opportunities, while commercial operators gain immediate insight into compliance status and performance against warranties.
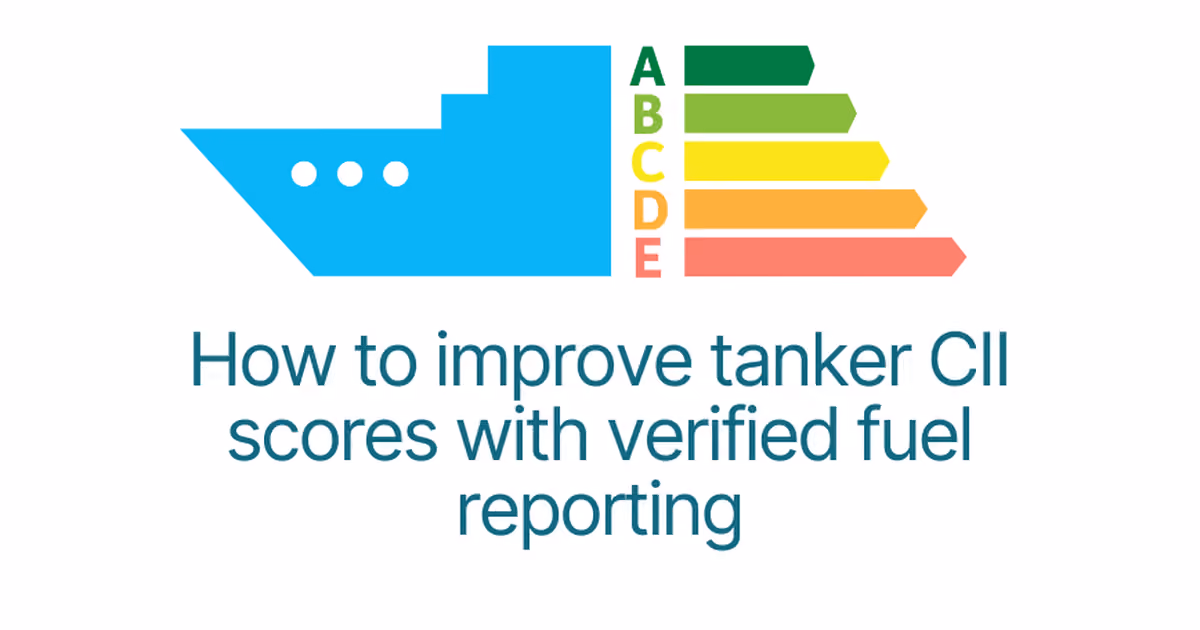
This shared understanding, built on trusted, normalised data, enables more productive discussions and collaborative decision-making. Teams can work together to balance operational efficiency, commercial obligations, regulatory compliance like CII monitoring available in SMARTShip Prime, and long-term asset health, driving better outcomes for the vessel and the business. Modern platforms provide this unified environment, turning complex data into a catalyst for aligned action and continuous improvement across the fleet.
.svg)
.svg)