
Stop reporting emissions, start managing them
Emission Analytics turns fleet, fuel and voyage data into verified emissions intelligence: one platform for CII, EU ETS, FuelEU, EU MRV, IMO DCS, Sea Cargo Charter and Scope 3. Track your CII rating live, forecast your exposure & defend every number before it locks in.
Proven impact across global fleets
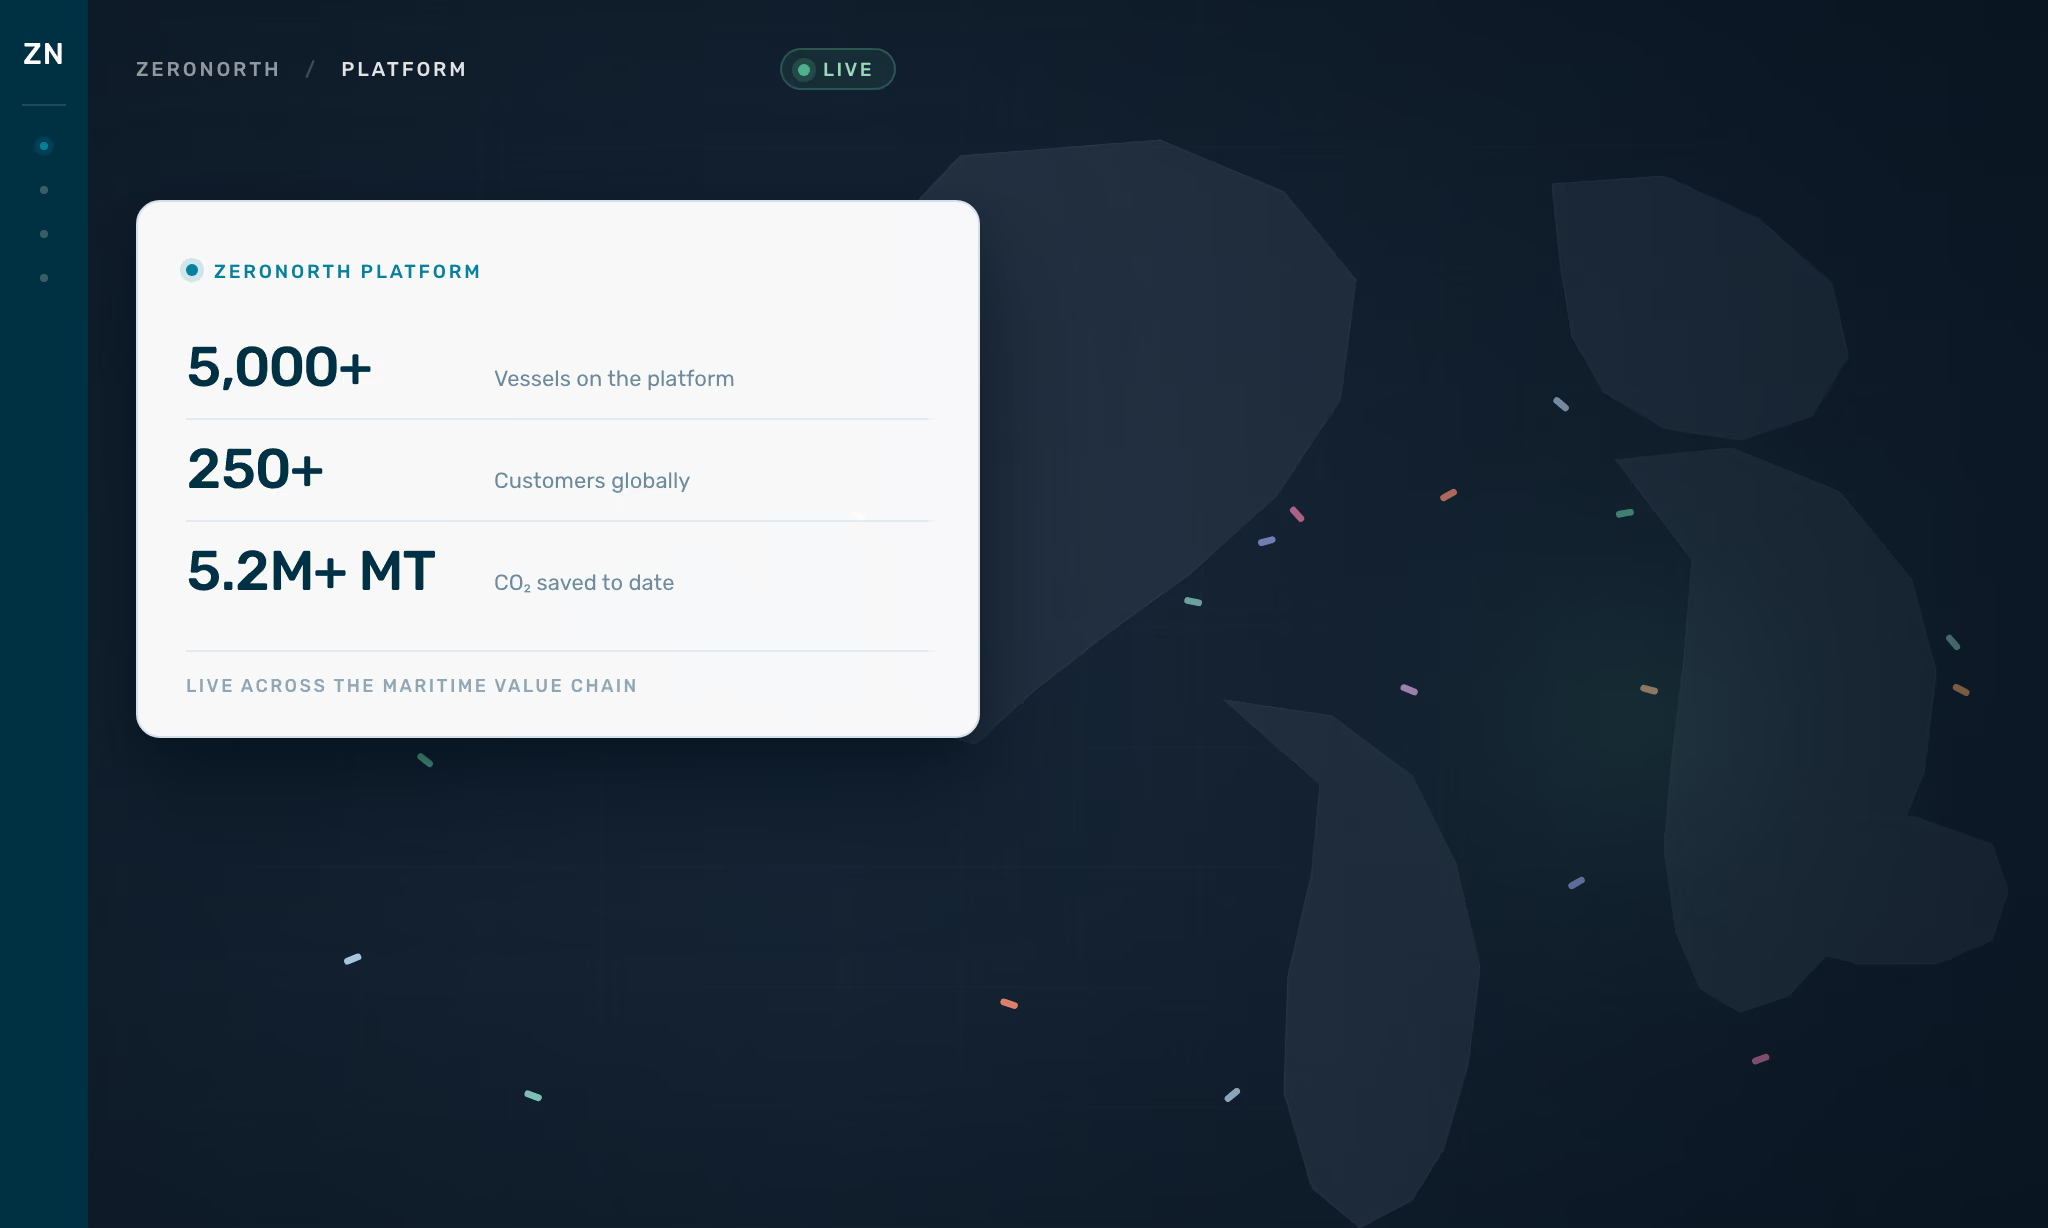
100%
200+
1.7T+










Make emissions measurable, actionable and defensible
Poor data quality and fragmented reporting limit visibility and delay decisions. Emission Analytics delivers a unified, validated view of fleet emissions so you can track, manage and act with confidence across every voyage.
Know where you stand, every day of the year
Track year-to-date CII, FuelEU intensity, EUA cost and compliance balance continuously, across fleet and vessel level. Set custom thresholds per vessel or pool and get alerted the moment emissions trends threaten your targets. Embedded validation catches bad data at the source, so the number on your dashboard is the number you can defend.
Find out more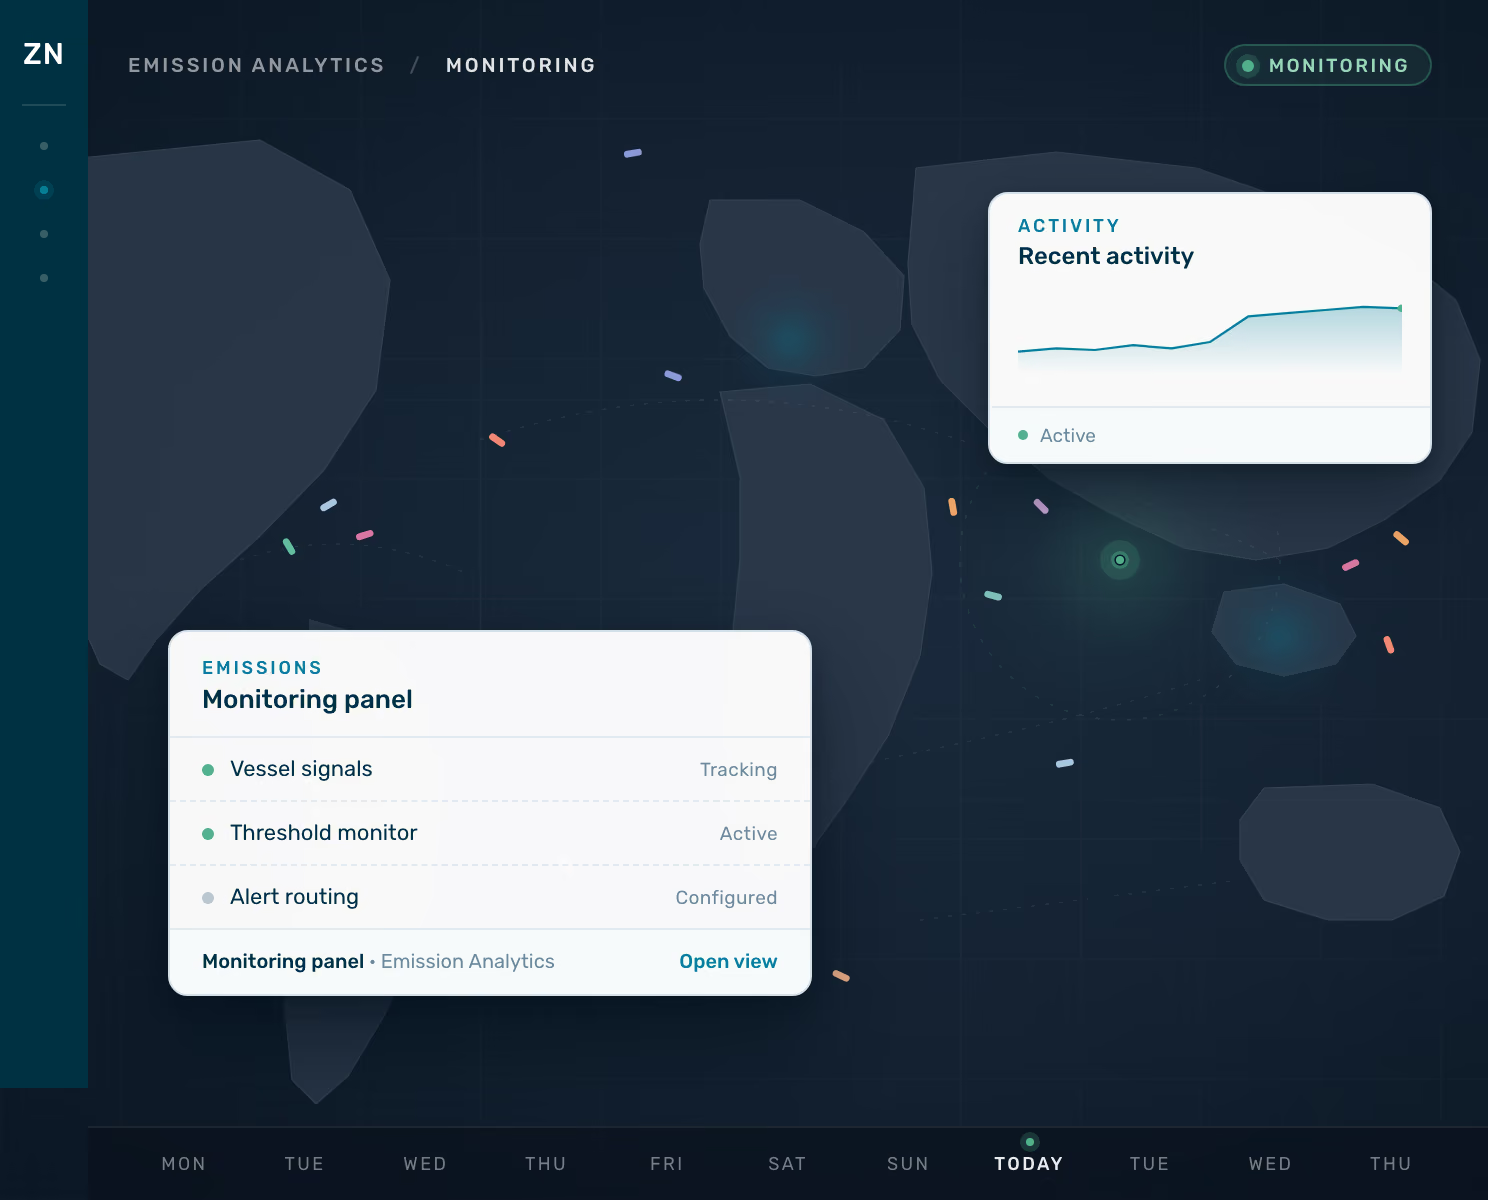
See the cost of a decision
before you make it
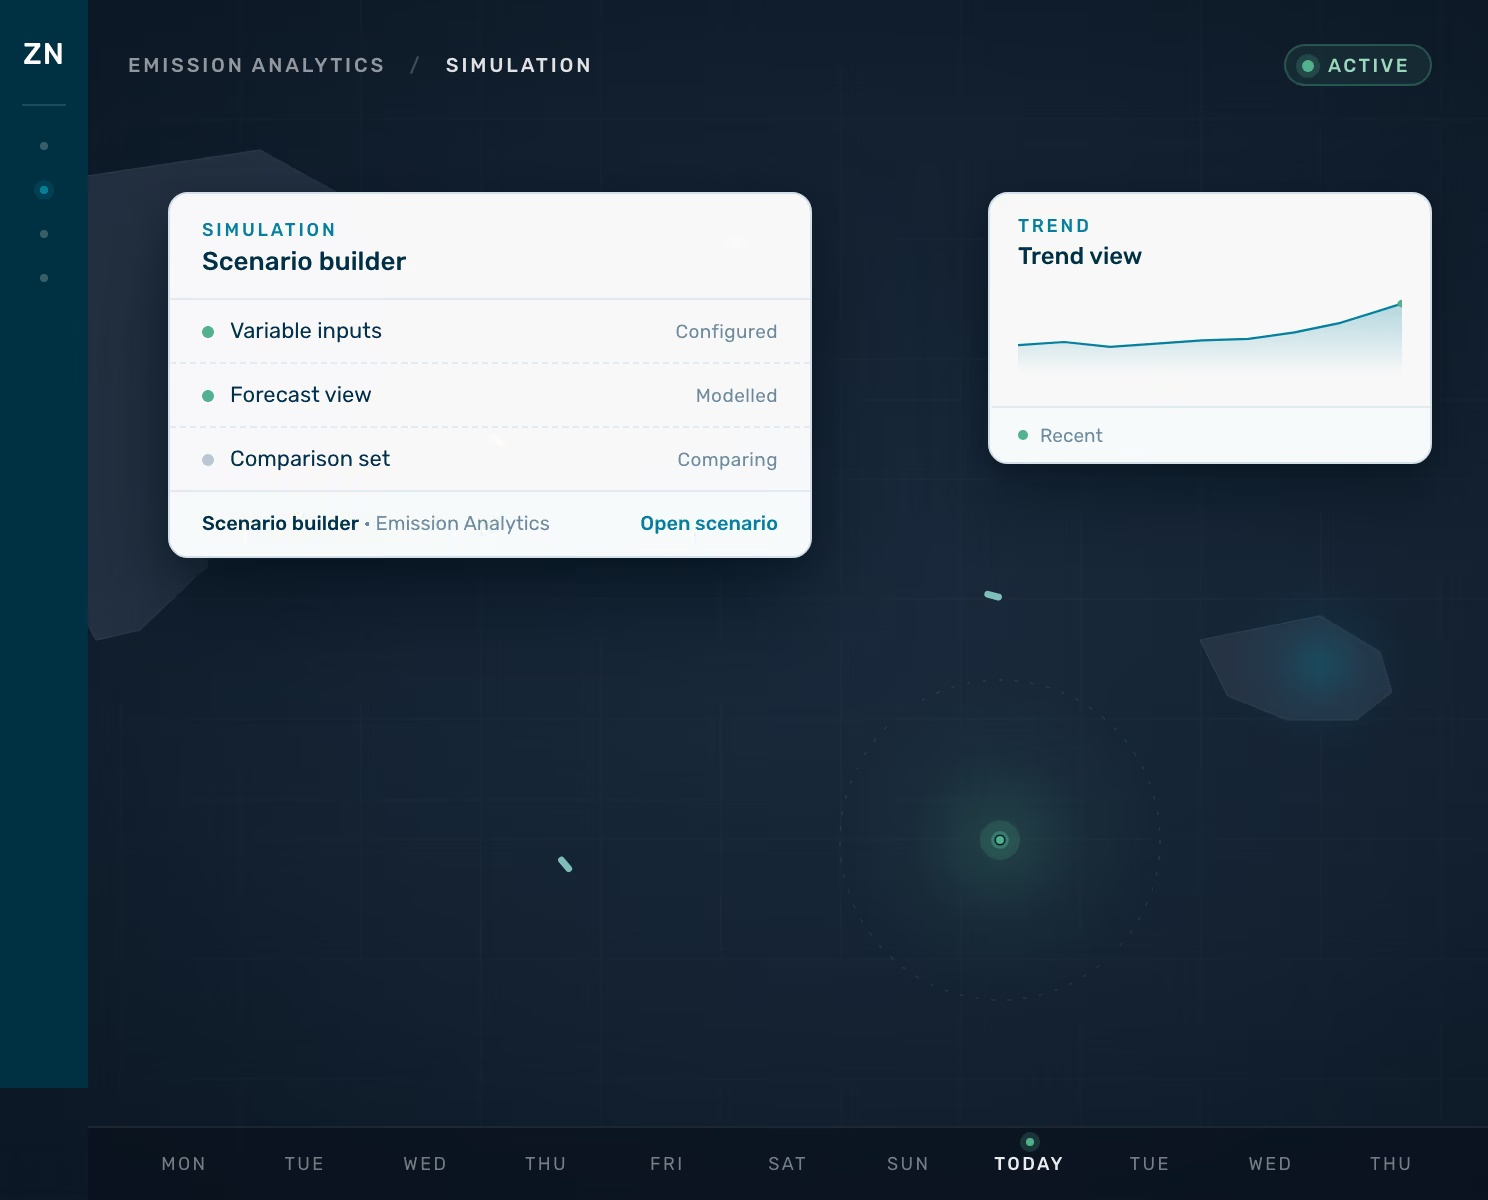
Model how a speed change, routing call or fuel switch moves your CII rating and EU ETS bill before the voyage is fixed. Pre-charter simulation turns regulatory exposure into a commercial input, not a year-end surprise.
Find out moreOne view, fleet down to voyage, no digging
Group fleets by ownership, charter agreement, fuel type or regulatory pool, then drill from headline KPIs into the voyage that moved them. See exactly which operating decisions shaped this week's compliance balance, and what that means for the rating you'll close the year on.
Find out more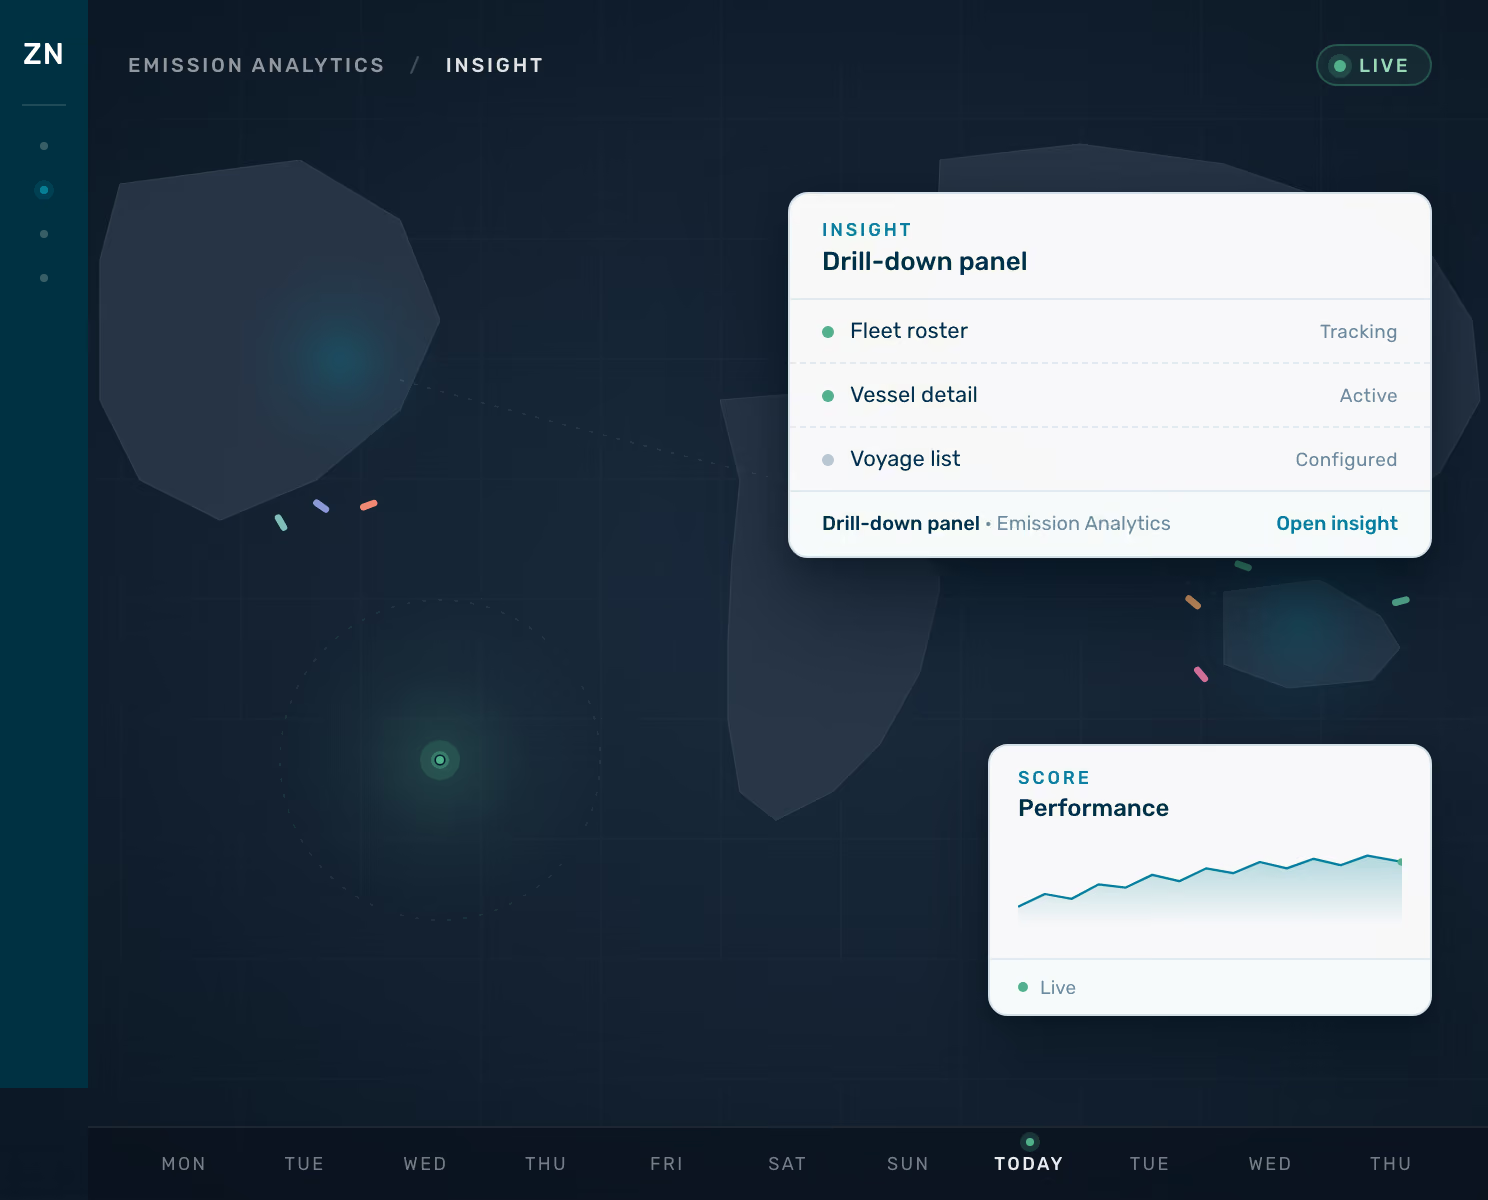

Submission-ready, not spreadsheet-ready
Generate reports for IMO DCS, EU MRV, UK MRV, FuelEU Maritime and Sea Cargo Charter from the same validated dataset. Export EU ETS in official XML straight to THETIS-EU. No reconciliation, no rework.
Find out moreYour emissions data, wherever your teams work
Push voyage-level emissions and EU ETS data into charter-party review, finance systems and fleet management tools automatically. No manual exports, no copy-paste, no version confusion. The data stays yours.
Find out more
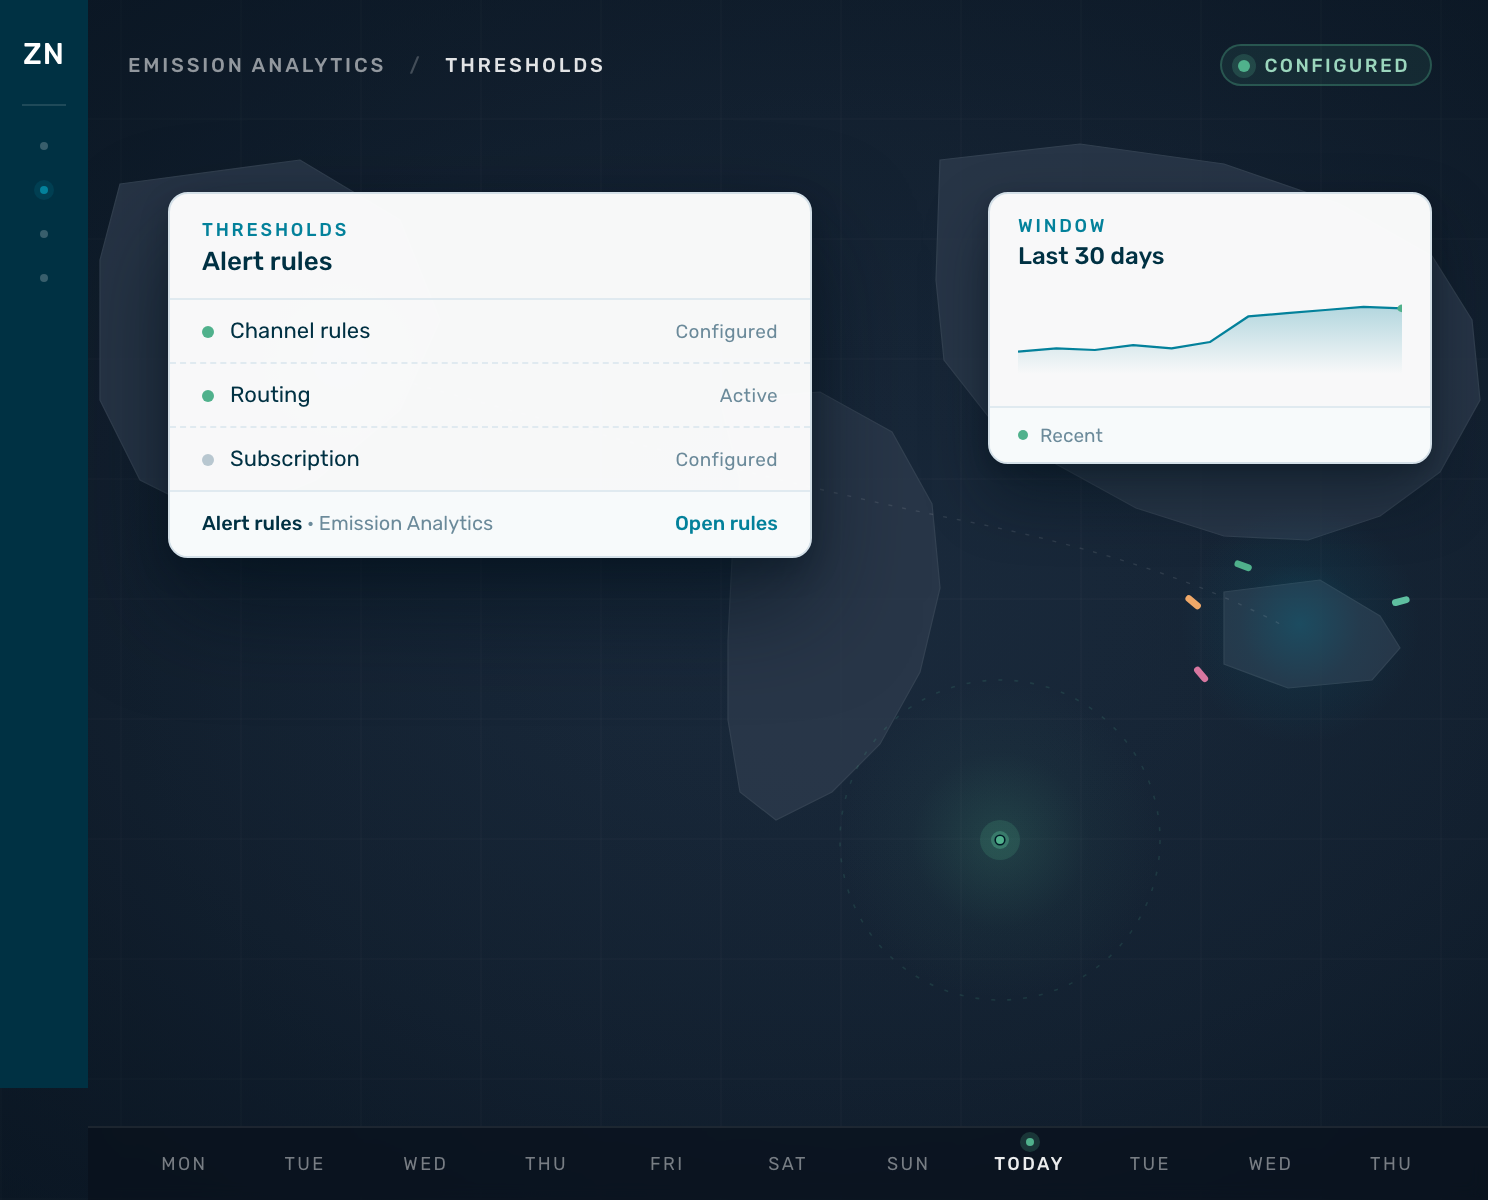
Set targets and know before you fall short
Configure emissions goals and CII thresholds per vessel, charter pool or commercial grouping. Get real-time alerts the moment trends threaten your targets, with enough runway to adjust speed, routing or fuel strategy before the rating locks in.
Find out moreHow Emission Analytics works
Emission Analytics turns vessel data into auditable, regulator-ready emissions evidence, with continuous monitoring across CII, EU ETS, FuelEU, EU MRV and IMO DCS.

Continuous emissions monitoring
Vessel-level CO2, methane and SOx tracked in real time across owned, managed and chartered tonnage. No quarterly catch-up exercises.

Forward simulation
Model the emissions impact of routing, speed, fuel and operational decisions before committing. Compliance becomes a planning input, not a year-end discovery.
.svg)
DNV-accredited workflows
Verification pathways align with class society standards. Audit trails are built into every transaction, not bolted on at filing time.

Submission-ready outputs
Automated filing for CII, EU ETS, FuelEU, EU MRV, UK MRV, IMO DCS and THETIS-EU. Distribution to charterers, financiers and regulators happens from one source.
The ZeroNorth advantage
Intelligence built for real maritime operations at scale.
.svg)
Numbers you can defend in a verification
Every figure traces back to validated source data, embedded controls and 200+ automated validation checks before any number is reported. When the auditor calls, you're not rebuilding the spreadsheet, you're walking them through a system of record.

Built to submit, not to reconcile
EU ETS exported as official XML, straight to THETIS-EU. Voyage-level data piped through the Public Emission API. No copy-paste, no month-end scramble, no chasing the crew for a number that should already be in the system.

One emissions truth, everywhere it matters
Emission Analytics isn't a reporting silo. The same validated data runs through voyage optimisation, chartering reviews and bunker decisions, so the number your sustainability team reports is the number your commercial team trades on.
A 30-minute walkthrough of the platform
See how ZeroNorth helps optimise voyages, reduce emissions, and improve operational performance in real time.
In case you missed anything.
Explore a curated collection of guides, tools, and insights designed to help you get the most out of our products and services.
What is Emission Analytics?
Emission Analytics is ZeroNorth's emissions intelligence service. It collects operational, fuel and voyage data from across your fleet, validates it, and turns it into continuous CII, EU ETS, EU MRV, FuelEU, IMO DCS, Sea Cargo Charter and Scope 3 reporting, all in one platform.
How is CII calculated?
CII is calculated by dividing a vessel's annual CO2 emissions by its transport work, typically distance travelled and cargo carried. The resulting intensity is compared against IMO thresholds to determine the vessel's rating for the year. Emission Analytics does this continuously, not once at year-end.
What is compliance balance and why is it important?
Compliance balance reflects the difference between allowed emissions and actual emissions over the year. Even if weekly performance appears stable, cumulative emissions can create a growing deficit. Emission Analytics surfaces compliance balance continuously so exposure is visible before it becomes penalty cost.
What is CII in shipping and why does it matter commercially?
The Carbon Intensity Indicator (CII) measures how efficiently a vessel transports cargo relative to its CO2 emissions. Vessels are rated annually from A to E. Lower ratings affect chartering attractiveness, regulatory scrutiny and long-term asset value, making CII a commercial performance metric, not just a compliance requirement.
How does ZeroNorth help prevent a D or E rating?
Emission Analytics provides real-time monitoring and forward simulation of year-to-date GHG intensity and compliance balance. By forecasting rating trajectory before year-end, operators can adjust speed, routing or fuel strategy early, reducing the risk of falling into D or E categories.
Does the platform support IMO DCS, EU MRV, FuelEU and EU ETS reporting?
Yes. Emissions data flows into structured reporting outputs aligned with IMO DCS, EU MRV, UK MRV, FuelEU Maritime and Sea Cargo Charter. EU ETS data is exported in official XML format for direct THETIS-EU upload. All reporting is generated from validated data, reducing manual reconciliation.
How do I pull emissions data into my own systems?
Via the Public Emission API. EU ETS and voyage-level emissions can be pulled directly into charter-party review, financial reporting and fleet management systems, with no manual extraction and no spreadsheet reconciliation. Data stays yours; distribution is fully under your control.
Where do I report on chartered vessels and third-party logistics?
Emission Analytics covers your own fleet. For Scope 3 emissions across chartered tonnage and third-party logistics aligned with CSRD, GHG Protocol Categories 4 and 9, and Sea Cargo Charter, see ZeroNorth Scope 3 Reporting.
How accurate are CII forecasts?
Forecast accuracy depends on the quality of the underlying data. Because Emission Analytics runs on validated, high-frequency vessel data rather than manual estimates, year-end CII projections track closely to final ratings, and they update continuously as new voyage data arrives, so teams can see rating risk early enough to act on it.
Which emissions monitoring software can automatically calculate CII scores for a mixed fleet via API?
ZeroNorth Emission Analytics automatically calculates CII scores at voyage, vessel and fleet level, across dry bulk, tanker, container and mixed fleets simultaneously. Year-to-date GHG intensity and compliance balance are monitored continuously with validation safeguards, and CII data is available via API or structured export so teams can pull scores directly into internal dashboards, charter party review workflows and fleet management systems.
What is EEOI and what unit is it measured in?
EEOI, the Energy Efficiency Operational Indicator, measures a vessel's actual in-service carbon efficiency. Its unit is grams of CO2 per tonne-nautical mile (gCO2/t-nm): CO2 emitted divided by cargo carried times distance sailed. Unlike an annual rating, EEOI reflects real operational performance voyage by voyage, so Emission Analytics tracks it continuously alongside CII, FuelEU and EU ETS metrics.
Who within the organisation typically uses Emission Analytics?
Compliance and ESG teams use it for regulatory reporting and audit trails; chartering teams use CII and FuelEU exposure in fixture decisions; technical managers track vessel efficiency and rating risk; and commercial leadership uses fleet-level dashboards to steer decarbonisation strategy. Because everyone works from the same validated data, the compliance number and the commercial number are always the same number.
What are the FuelEU Maritime GHG intensity reduction targets from 2025 to 2050?
FuelEU Maritime sets binding GHG intensity reductions versus the 2020 baseline: 2% by 2025, 6% by 2030, 14.5% by 2035, 31% by 2040, 62% by 2045 and 80% by 2050. The regulation applies from 1 January 2025 to vessels of 5,000 GT and above calling at EU and EEA ports. Emission Analytics supports FuelEU compliance with tank-based GHG intensity tracking per voyage and continuous compliance balance monitoring.
What is the difference between gross emissions and net emissions?
Gross emissions are the total CO2 a vessel or fleet actually emits. Net emissions are gross emissions minus any verified reductions or offsets, for example lower-carbon fuels or certified removals. Regulators assess gross emissions per voyage, while net emissions show progress against decarbonisation targets. Emission Analytics tracks both from validated data, so the picture is always auditable.
Engineering the future of sustainable trade, technology to help shipping operate at its full potential.